The GC, unfortunately, as expounded in the examples above, has the tendency to promote lazy programming.
Clearly the benefits of the GC to assist in memory management are there, and help to maintain a stable system, but it is no excuse to not plan and test your code properly.
Always re-read your code critically and objectively to ensure that you are not introducing memory leaks unintentionally.Performance Considerations
We have already mentioned in the previous section that simply collecting the possible roots had a very tiny performance impact, but this is when you compare PHP 5.2 against PHP 5.3. Although the recording of possible roots compared to not recording them at all, like in PHP 5.2, is slower, other changes to the PHP runtime in PHP 5.3 prevented this particular performance loss from even showing.
There are two major areas in which performance is affected. The first area is reduced memory usage, and the second area is run-time delay when the garbage collection mechanism performs its memory cleanups. We will look at both of those issues.
Reduced Memory Usage
First of all, the whole reason for implementing the garbage collection mechanism is to reduce memory usage by cleaning up circular-referenced variables as soon as the prerequisites are fulfilled. In PHP's implementation, this happens as soon as the root-buffer is full, or when the function gc_collect_cycles() is called. In the graph below, we display the memory usage of the script below, in both PHP 5.2 and PHP 5.3, excluding the base memory that PHP itself uses when starting up.
Example #1 Memory usage example
<?php
class Foo
{
    public $var = '3.14159265359';
    public $self;
}

$baseMemory = memory_get_usage();

for ( $i = 0; $i <= 100000; $i++ )
{
    $a = new Foo;
    $a->self = $a;
    if ( $i % 500 === 0 )
    {
        echo sprintf( '%8d: ', $i ), memory_get_usage() - $baseMemory, "\n";
    }
}
?>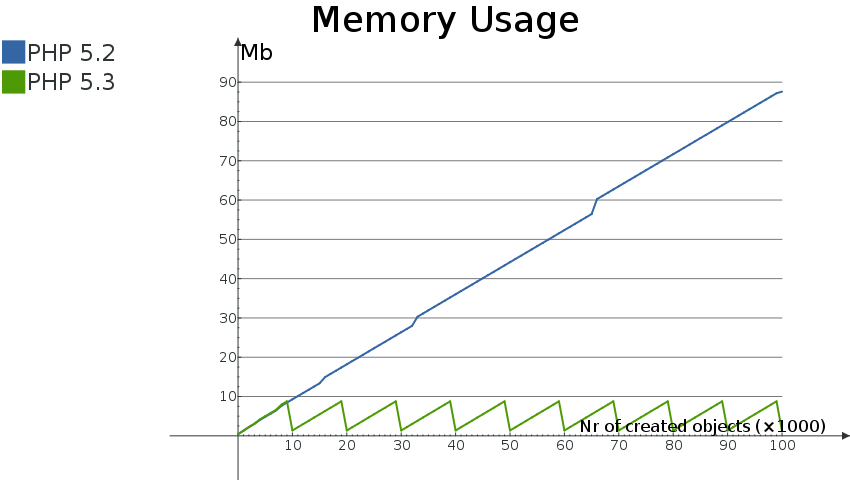
In this very academic example, we are creating an object in which a property is set to point back to the object itself. When the $a variable in the script is re-assigned in the next iteration of the loop, a memory leak would typically occur. In this case, two zval-containers are leaked (the object zval, and the property zval), but only one possible root is found: the variable that was unset. When the root-buffer is full after 10,000 iterations (with a total of 10,000 possible roots), the garbage collection mechanism kicks in and frees the memory associated with those possible roots. This can very clearly be seen in the jagged memory-usage graph for PHP 5.3. After each 10,000 iterations, the mechanism kicks in and frees the memory associated with the circular referenced variables. The mechanism itself does not have to do a whole lot of work in this example, because the structure that is leaked is extremely simple. From the diagram, you see that the maximum memory usage in PHP 5.3 is about 9 Mb, whereas in PHP 5.2 the memory usage keeps increasing.
Run-Time Slowdowns
The second area where the garbage collection mechanism influences performance is the time taken when the garbage collection mechanism kicks in to free the "leaked" memory. In order to see how much this is, we slightly modify the previous script to allow for a larger number of iterations and the removal of the intermediate memory usage figures. The second script is here:
Example #2 GC performance influences
<?php
class Foo
{
    public $var = '3.14159265359';
    public $self;
}

for ( $i = 0; $i <= 1000000; $i++ )
{
    $a = new Foo;
    $a->self = $a;
}

echo memory_get_peak_usage(), "\n";
?>
We will run this script two times, once with the zend.enable_gc setting turned on, and once with it turned off:
Example #3 Running the above script
time php -dzend.enable_gc=0 -dmemory_limit=-1 -n example2.php
# and
time php -dzend.enable_gc=1 -dmemory_limit=-1 -n example2.php
On my machine, the first command seems to take consistently about 10.7 seconds, whereas the second command takes about 11.4 seconds. This is a slowdown of about 7%. However, the maximum amount of memory used by the script is reduced by 98% from 931Mb to 10Mb. This benchmark is not very scientific, or even representative of real-life applications, but it does demonstrate the memory usage benefits that this garbage collection mechanism provides. The good thing is that the slowdown is always the same 7%, for this particular script, while the memory saving capabilities save more and more memory as more circular references are found during script execution.
PHP's Internal GC Statistics
It is possible to coax a little bit more information about how the
garbage collection mechanism is run from within PHP. But in order to do
so, you will have to re-compile PHP to enable the benchmark and
data-collecting code. You will have to set the CFLAGS
environment variable to -DGC_BENCH=1 prior to running
./configure with your desired options. The following
sequence should do the trick:
Example #4 Recompiling PHP to enable GC benchmarking
export CFLAGS=-DGC_BENCH=1
./config.nice
make clean
make
When you run the above example code again with the newly built PHP binary, you will see the following being shown after PHP has finished execution:
Example #5 GC statistics
GC Statistics
-------------
Runs:               110
Collected:          2072204
Root buffer length: 0
Root buffer peak:   10000

      Possible            Remove from  Marked
        Root    Buffered     buffer     grey
      --------  --------  -----------  ------
ZVAL   7175487   1491291    1241690   3611871
ZOBJ  28506264   1527980     677581   1025731
The most informative statistics are displayed in the first block. You can see here that the garbage collection mechanism ran 110 times, and in total, more than 2 million memory allocations were freed during those 110 runs. As soon as the garbage collection mechanism has run at least one time, the "Root buffer peak" is always 10000.
Conclusion
In general the garbage collector in PHP will only cause a slowdown when the cycle collecting algorithm actually runs, whereas in normal (smaller) scripts there should be no performance hit at all.
However, in the cases where the cycle collection mechanism does run for normal scripts, the memory reduction it will provide allows more of those scripts to run concurrently on your server, since not so much memory is used in total.
The benefits are most apparent for longer-running scripts, such as lengthy test suites or daemon scripts. Also, for » PHP-GTK applications that generally tend to run longer than scripts for the Web, the new mechanism should make quite a bit of a difference regarding memory leaks creeping in over time.
+add a note
User Contributed Notes 2 notes
Talisman 
8 years ago
Dmitry dot Balabka at gmail dot com 
5 years ago
There is a possibility to get GC performance stats without PHP recompilation. Starting from Xdebug version 2.6 you are able to enable stats collection into the file (default dir /tmp with name gcstats.%p):

php -dxdebug.gc_stats_enable=1 your_script.php